Faces of HIV
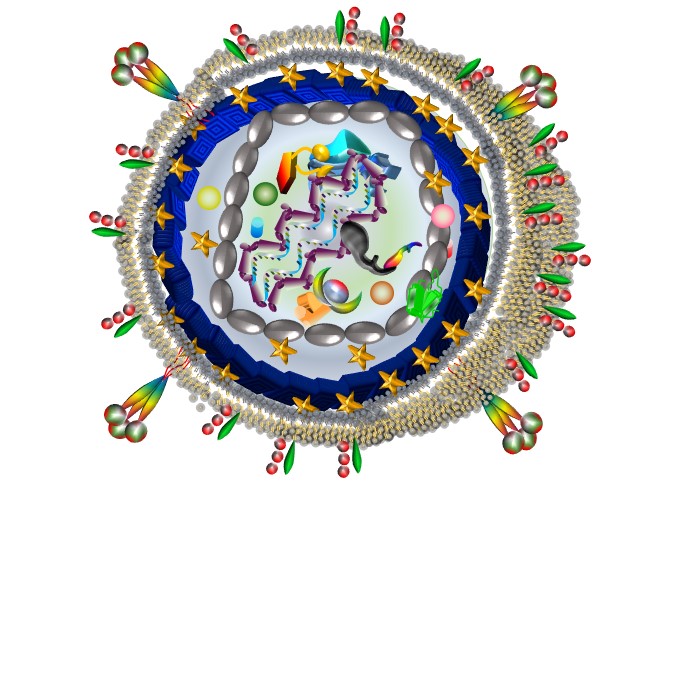
Structure of HIV genome
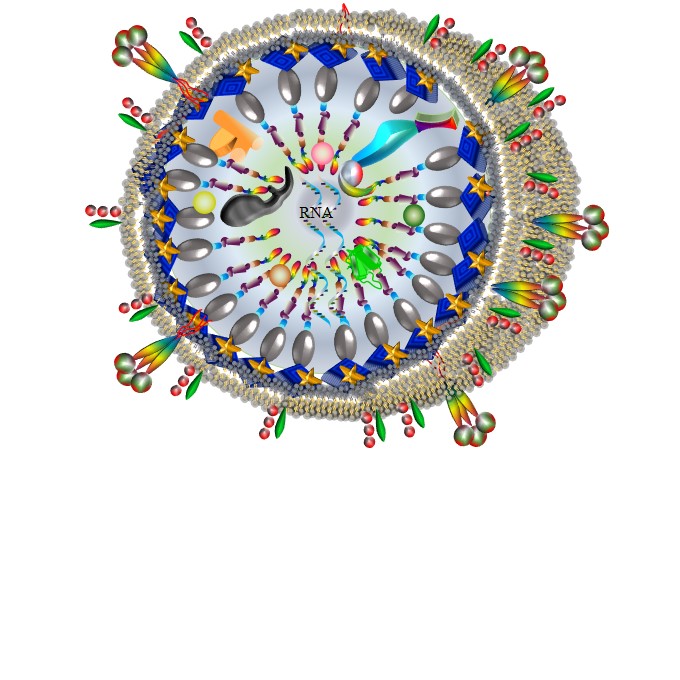
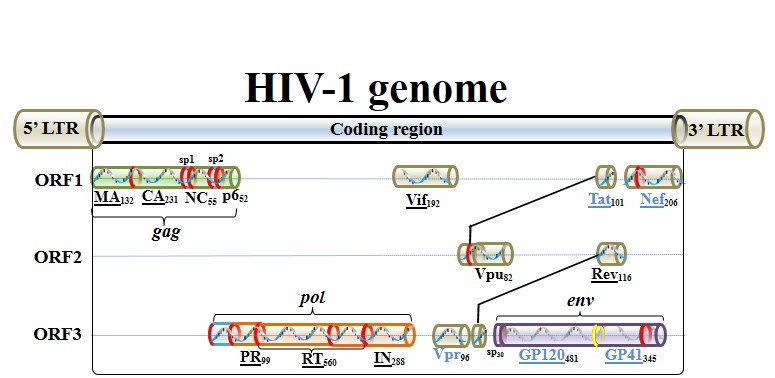
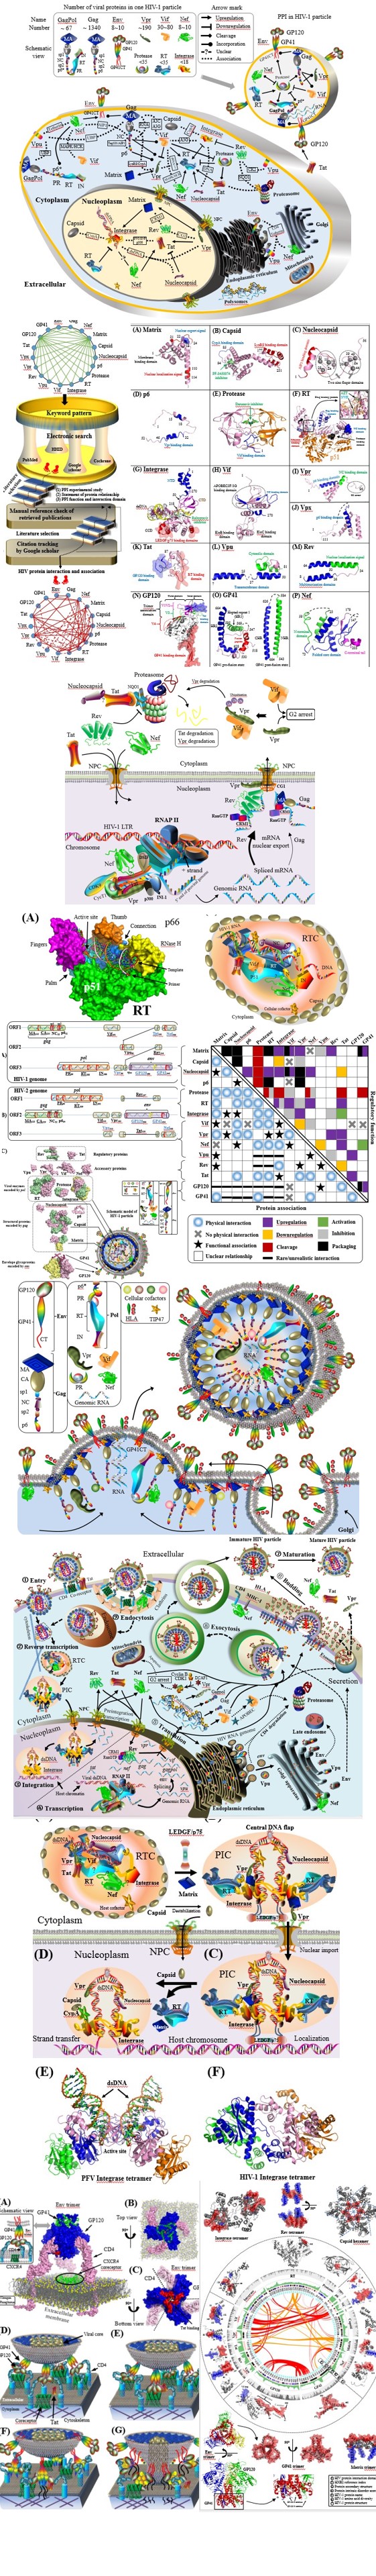
Landmark of HIV-1 genome, which encodes 15 proteins in three open reading frames (ORFs).
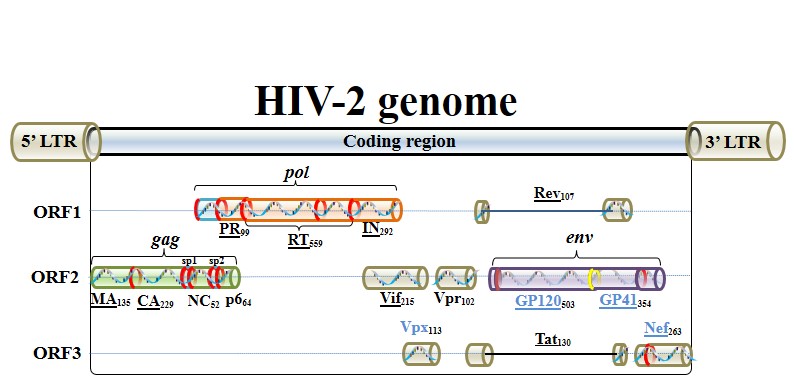
Landmark of HIV-2 genome, which encodes 15 proteins in three open reading frames (ORFs).
HIV proteins
Further details of these viral proteins can be found by clicking protein names:
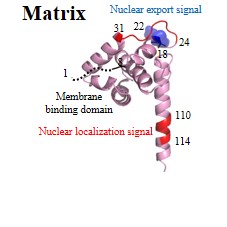
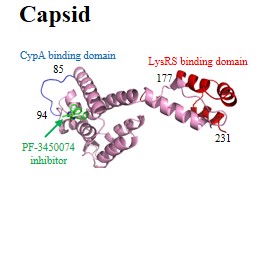
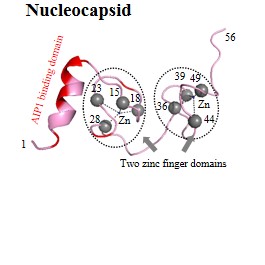
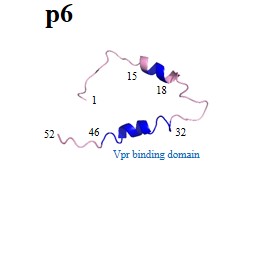
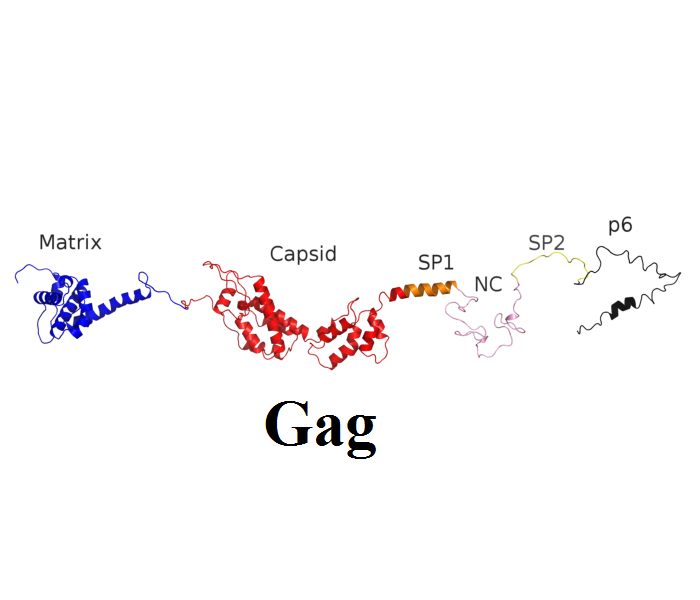
| Structural (poly)proteins: | Matrix | Capsid | Nucleocapsid | p6 | Gag |
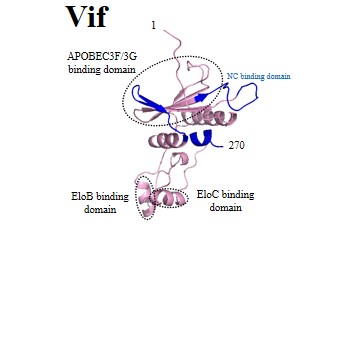
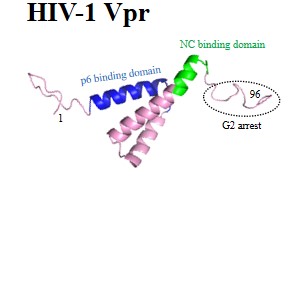
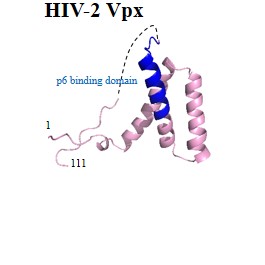
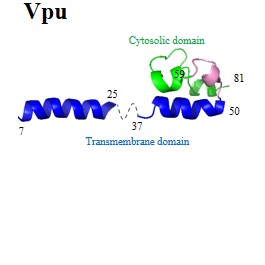
| Accessory proteins: | Vpu | Vpr | Vpx | Vif | Nef |
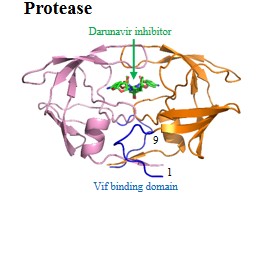
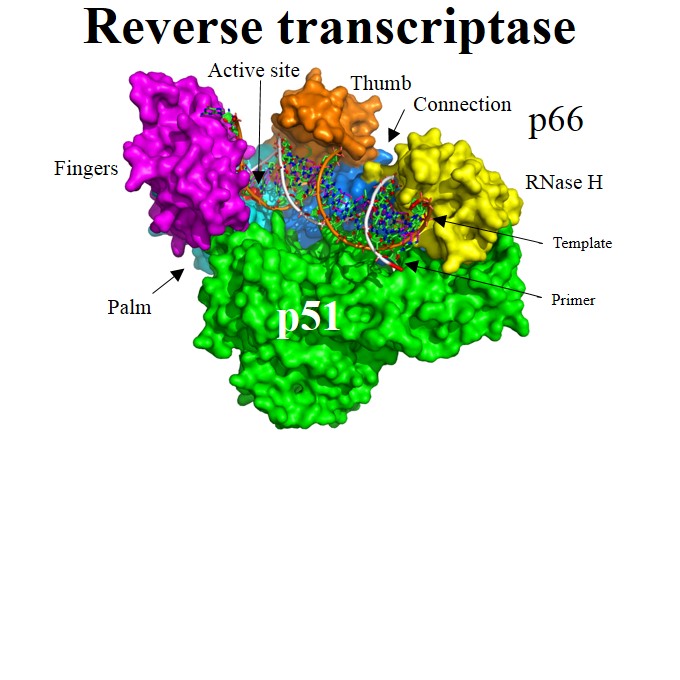
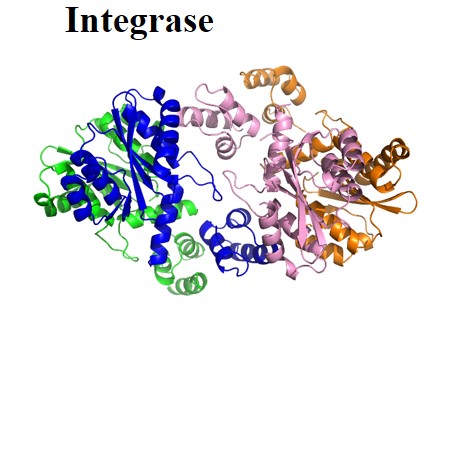
| Viral enzymes: | Protease | Reverse transcriptase | Integrase | Pol | |
| Envelope glycoproteins: | GP120 | GP41 | Env | ||
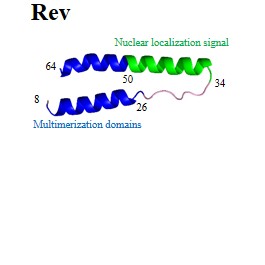
| Regulatory proteins: | Rev | Tat |
Please watch movies by clicking the picture
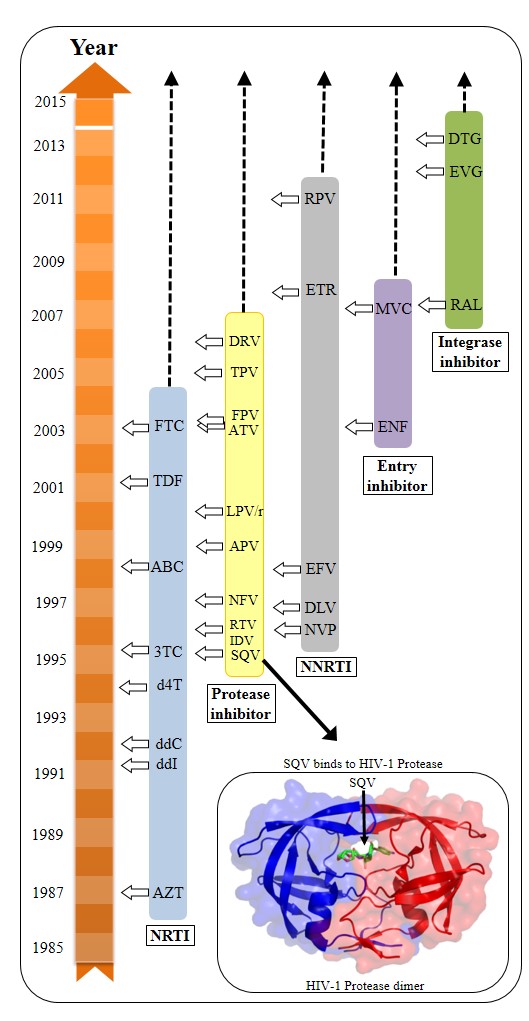
Overview of anti-HIV drugs
Five drug classes have been approved by FDA, including:
- (1) NRTI: Nucleoside analog Reverse Transcriptase Inhibitor
- (2) NNRTI: Non-nucleoside analog Reverse Transcriptase Inhibitor
- (3) PI: Protease inhibitor
- (4) II: Integrase inhibitor
- (5) EI: entry (fusion) inhibitor
HIV-1 life cycle
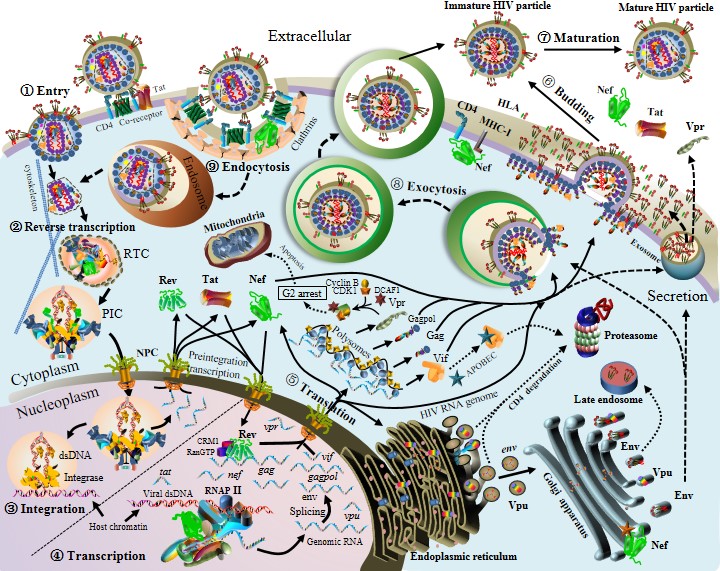
Overview of HIV-1 life cycle
The birth of a HIV-1 virion undertakes a journey. Nine stages are defined: (1) Viral entry (viral fusion); (2) Reverse transcription; (3) Viral integration; (4) Viral transcription; (5) Viral translation; (6) Viral assembly and budding; (7) Viral maturation. Note that protein shapes and sizes in figure are not to scale. More details can be found as follows.
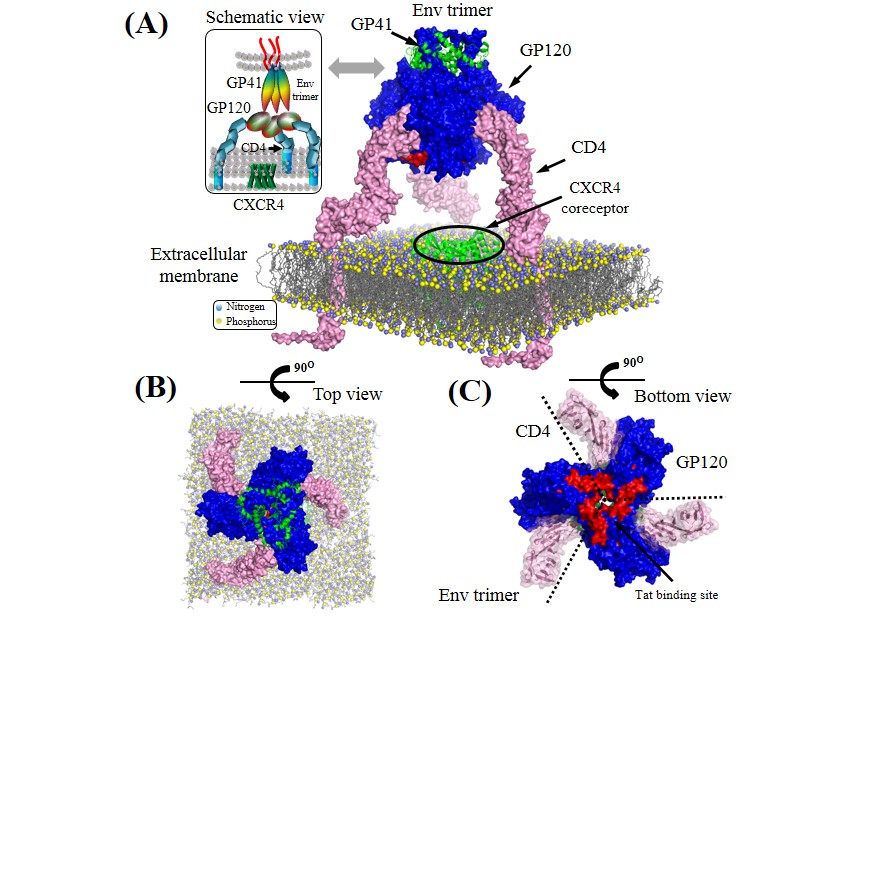
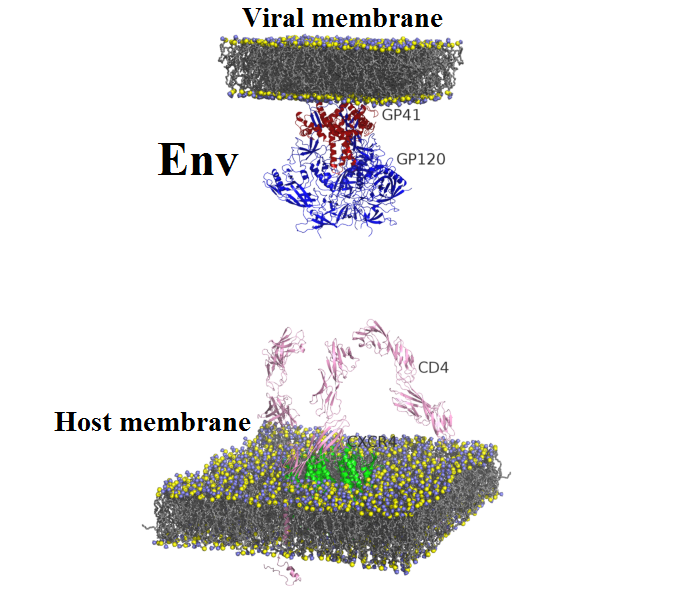
Env trimer complexed with CD4.
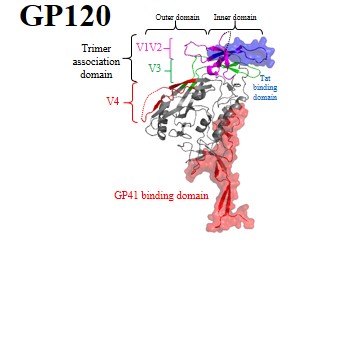
Surface representation of GP120, GP41 and CD4 proteins are colored by blue, green and pink, respectively. Lipid bilayers of extracellular membrane are shown at the bottom where nitrogen and phosphorus are indicated by blue and yellow spheres. Crystalized structure of CXCR4 coreceptor in green is placed in the center across the extracellular membrane. Tat binding site is indicated by red areas on the GP120 surface (positions: 155–173). Lipid bilayers of extracellular membrane are shown at the bottom where nitrogen and phosphorus are indicated by blue and yellow spheres. Crystalized structure of CXCR4 coreceptor in green is placed in the center across the extracellular membrane.
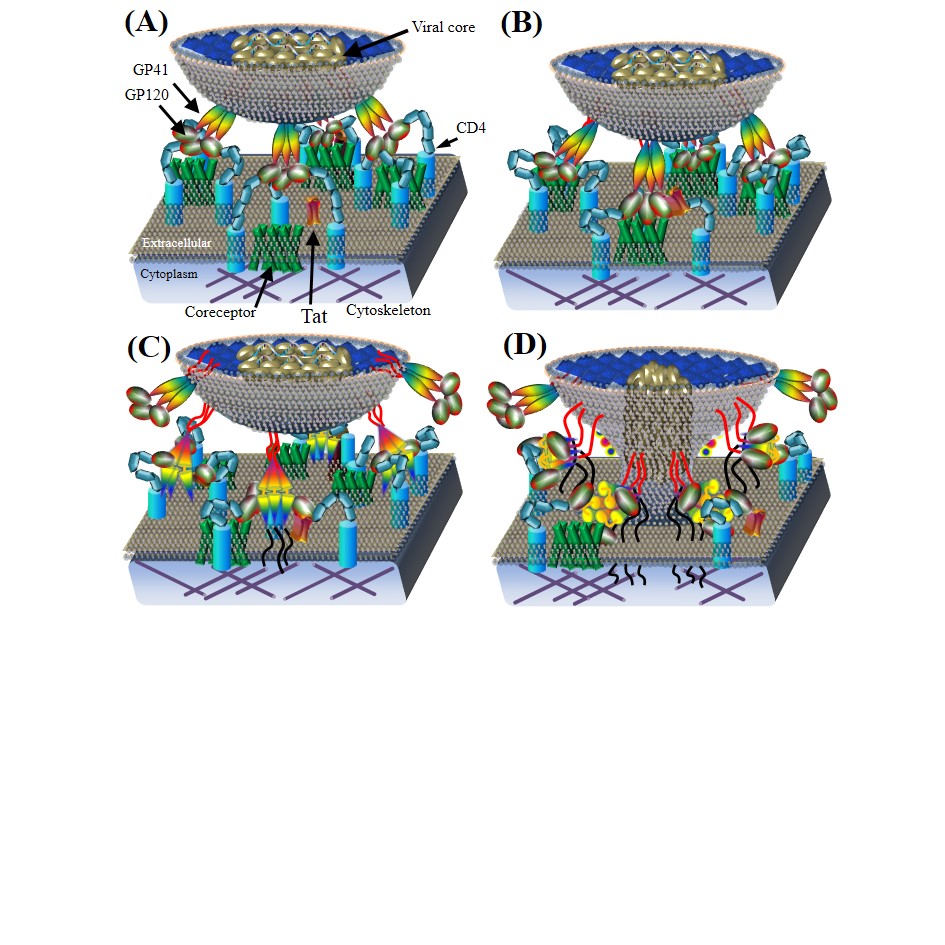
HIV viral entry.
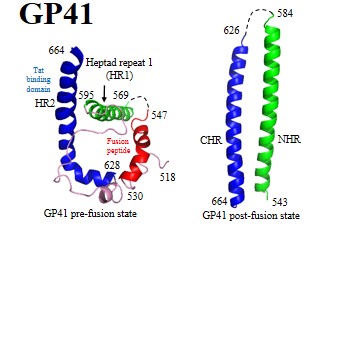
(A) CD4 binds to GP120 subunits in the Env trimer. Red area in the center indicates Tat binding sites. (B) Env binding to CD4 and coreceptors for viral attachment on host membrane. GP120 on the mature virion surface interacts with CD4 to induce the aggregation of CD4 and chemokine coreceptors (e.g. CCR5, CXCR4). After the GP120–CD4 interaction, GP120 binds to chemokine coreceptors (e.g. CCR5, CXCR4) on extracellular surfaces. (C) Construction of GP41 six–helix bundles. Interactions between GP120 and chemokine coreceptors induce conformation rearrangements in GP120 which expose GP41 to construct the six–helix bundles.(D) Viral entry. GP41 six–helix bundles pull the viral core to enter the cytoplasm of host cells through newly–created fusion pores. The viral core in a HIV particle is then injected into host cells.
HIV-1 reverse transcription complex.
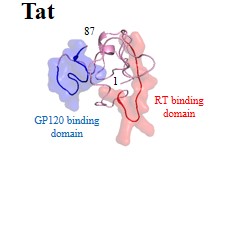
Schematic model of HIV-1 pairwise protein interactions in the RTC. HIV-1 RTC consists of RT, Integrase, Nucleocapsid, Vif, Tat, Nef and Vpr, allowing for HIV-1 pairwise protein interactions: RT–Integrase, RT–Nucleocapsid, RT–Vif, RT–Tat, RT–Nef and RT–tRNALys3–Vpr. Marked by yellow stars, cellular cofactors (e.g. CypA) also interact with RTC to facilitate HIV-1 reverse transcription. Question marks indicate unclear interaction domains. Note that protein shapes and sizes are not to scale.
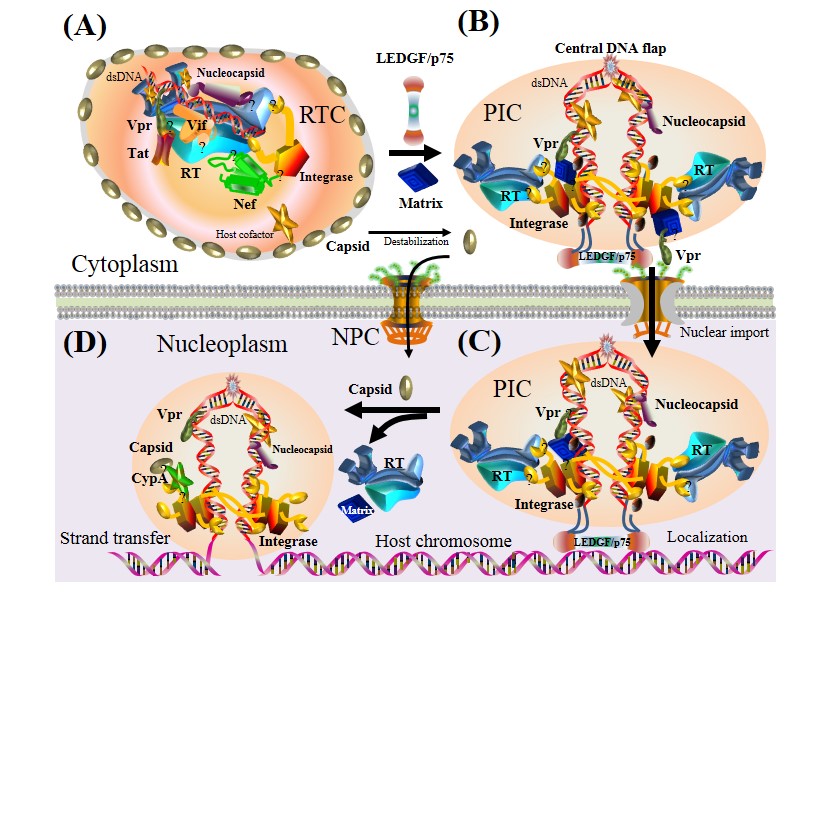
Model of viral integration.
(A) Viral uncoating. RTC turns into PIC with the recruitment of Matrix and host factors (e.g. LEDGF/p75). In this process, Nef, Tat and most Capsid proteins are dissociated from PIC. At the late stages of viral integration, Rev interacts with Integrase to prevent the nuclear import of overexpressed PIC. Question marks indicate unclear interaction positions. (B) Nuclear import. PIC is imported from the cytoplasm to the nucleoplasm by entering the nuclear pore complex (NPC). Vpr directly interacts with NPC for PIC nuclear import. (C) Chromosome localization. HIV-1 dsDNA in PIC is tethered to host chromosome via cellular protein LEDGF/p75. (D) Integration. HIV-1 dsDNA is integrated into host chromosome by Integrase.
Model of HIV-1 transcription.
Tat binds to the TAR of viral RNA which is a regulatory element located at the downstream of HIV-1 LTR. Subsequently, Tat recruits positive transcription elongation factors to construct a transcription complex. This complex activates kinase CDK9 for the hyperphosphorylation of RNA polymerase II (RNAP II). The hyperphosphorylated RNAP II interacts with Tat and other transcription elongation factors to produce viral genomic RNA. Many copies of genomic mRNAs are spliced after the transcription. Thereafter, nuclear export of these RNAs is accomplished by either Rev– or Matrix–mediated pathways. Rev collaborates with cellular factors CRM1 and RanGTP to export most genomic and sliced RNAs from the nucleoplasm to the cytoplasm. Vpr binding to NPC is predominantly localized in the nuclear envelope of the nucleus. RNA nuclear export is activated by nuclear export signal of Matrix which interacts with CRM1. When expressed in the cytoplasm, both Vif and Vpr can independently trigger G2 cell cycle arrest, whereas Vif interacts with Vpr to induce the Vpr degradation.
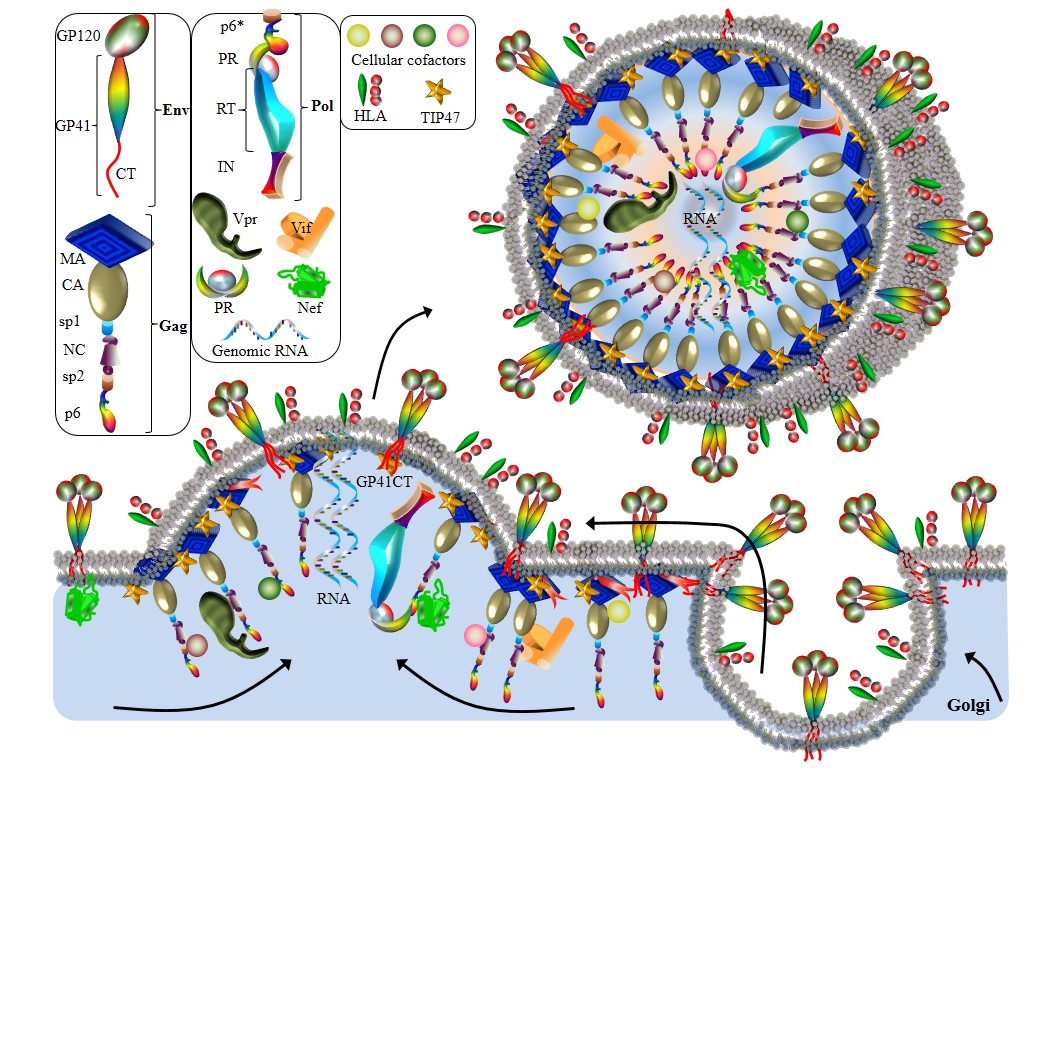
Model of HIV-1 budding.
Env trimers are exported to extracellular membrane through a secretory pathway. Gag targets to the membrane rafts where glycolipids, cholesterol and sphingolipids are abundant. Several protein interactions have been observed. (1) MatrixGag–GP41Env interaction. The N–myristoylation domain of MatrixGag interacts with GP41Env to incorporate Gag into HIV particles. This interaction is mediated by cellular cofactor TIP47. (2) NCGag–Vif interaction. NCGag interacts with Vif to accomplish Vif incorporation. (3) Vpr–Gag interaction. Vpr incorporation into nascent virions relies on the binding of Vpr to NCGag and p6. (5) Env–Nef interaction. Nef enhances the Env incorporation. (6) Nef–p6*Gagpol interaction promotes the Nef incorporation. On the membrane of a HIV-1 particle, approximately 50 to 63 HLA–II complexes are incorporated.
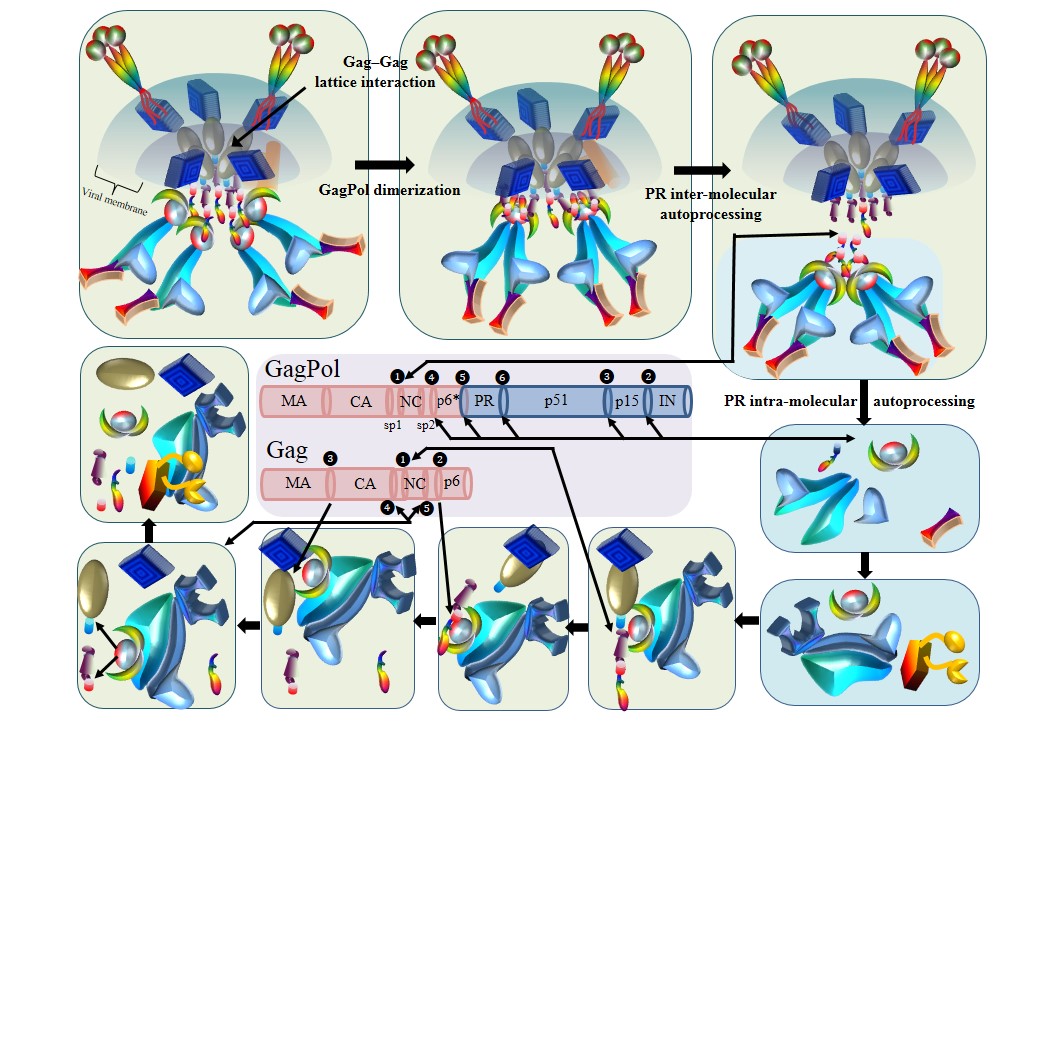
Model of HIV-1 maturation.
Protease-mediated proteolytic processing on Gag and GagPol precursor proteins during viral maturation. Seven steps have been recorded. (1) GagPol precursors aggregate in proximity using the Gag–Gag lattice interaction. (2) GagPol dimerization within two Gagpol precursors induces the construction of Protease dimers with a low enzymatic activity [445]. (3) Protease intra–molecular autoprocessing. The cleave site between Nucleocapsid and SP1 is cleaved by Protease within the same Gagpol dimer. (4) Protease inter–molecular autoprocessing. Protease in one Gagpol dimer cleaves p6*–Protease, PR–p51, p51–p15 and p15–Integrase cleavage sites in the other GagPol dimer. (5) Integrase and RT are folded after the maturation. (6) Mature Protease cleaves Gag precursors in a specific order, which frees MA, CA, SP1, NC, SP2 and p6 from Gag precursors. (7) After the maturation of HIV-1 proteins, a series of conformation rearrangements turn immature particles into mature particles.
HIV pairwise protein associations
Summary of HIV-1 pairwise protein associations.
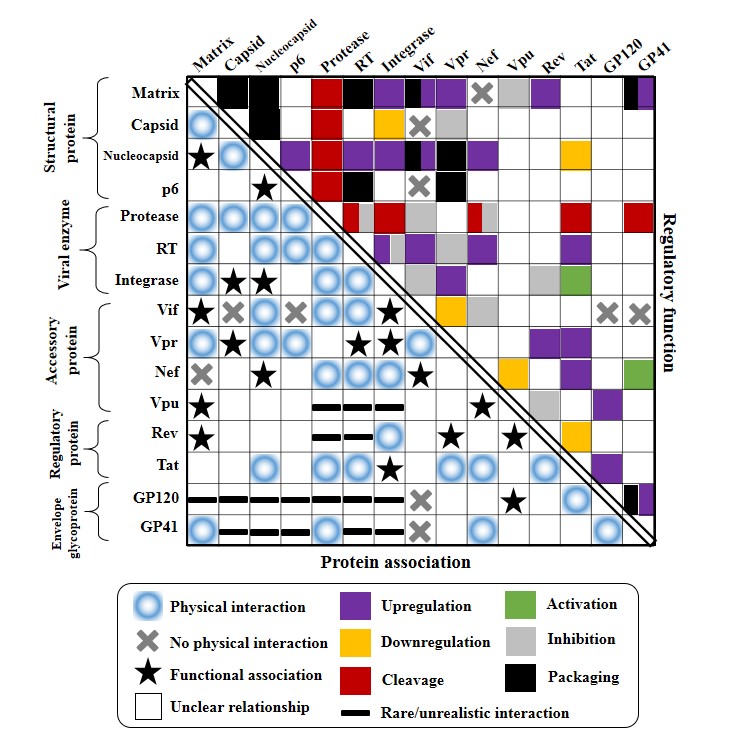
Fifteen HIV-1 protein names are shown on the left and the top side of the chess table. Five HIV-1 protein classes (envelope glycoprotein, regulatory protein, accessory protein, viral enzyme, structural protein) are shown on the left side. The bottom left side of the table summarizes the documented HIV-1 pairwise protein associations. (1) Blue circles indicate physical interactions between HIV-1 proteins. (2) Black crosses represent the absence of physical interactions between HIV-1 proteins, which have been confirmed by cell–free or cell–culture assays. (3) Black stars indicate protein associations that two HIV protein are associated via physical interactions with a third molecular. (4) Black lines suggest rare or unrealistic direct interactions between HIV proteins, which are unlikely to take place during the HIV-1 life cycle. The upper right side of the table demonstrates biological functions of HIV-1 pairwise protein associations. Six functions are mapped with different colors: upregulation (blue), downregulation (yellow), red (cleavage), activation (green), inhibition (grey) and incorporation (black). If one protein association bears multiple functions, the mapped squares combine different colors inside one cell.
HIV-1 protein interactions during viral life cycle.
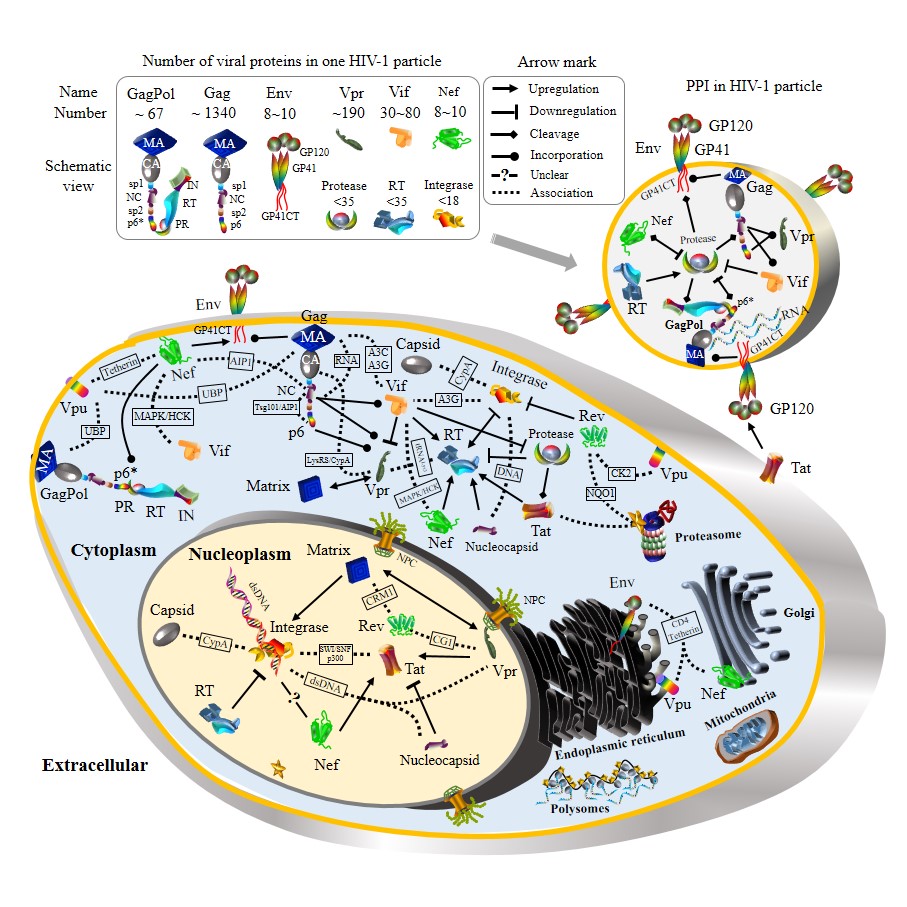
In the upfront box, viral proteins in one HIV-1 particle are annotated with their approximate numbers (see details in the section of “Viral budding”). Physical interactions between HIV-1 proteins are shown by different arrow marks, annotated by the inserted box on top. Dash lines demonstrate functional protein associations in which two HIV-1 proteins interact with a third molecule, whose name is placed within a text box. Table 1 and Table 2 summarize protein associations at each stage of the HIV-1 life cycle. Detailed signaling pathways and mechanisms are described in main text. Note that HIV-1 protein shapes and sizes are not to scale.
HIV-1 protein interaction patterns.
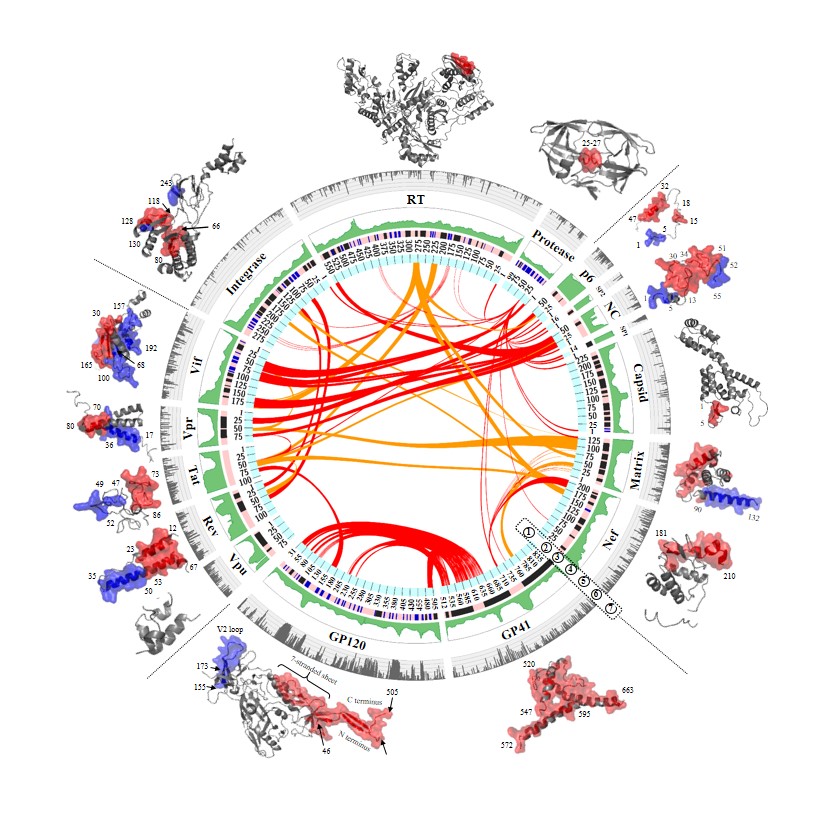
An integrated map of HIV-1 pairwise protein interactions at the full-length genome. Fifteen HIV-1 proteins are plotted in the circle with seven layers. Layer 1: red links in the center indicate the resolved interaction domains for HIV-1 pairwise protein interactions, identified by cell-free or cell-culture experiments (Table 1). Orange links indicate physical interactions between HIV-1 protein pairs but their interaction domains have not been resolved (Table 1). Layer 2: indices of amino acid positions are annotated based on HIV-1 HXB2 reference. Layer 3: protein secondary structures (dark blue: helix structures, light blue: beta-strand structures, pink: random-coil structures). Layer 4: intrinsic disorder scores of individual amino acid positions are visualized in green. The range of intrinsic disorder score is between 0 and 1 (the larger the value, the higher the structural variability). Layer 5: fifteen HIV-1 proteins have their names annotated accordingly. Layer 6: amino acid genetic diversity of HIV-1 subtype B genome is exhibited in grey. The diversity values between 0 and 1 are mapped on five sub–layers. Layer 7: protein interaction domains are mapped on cartoon representations of crystalized protein structures.
This is a picture gallery of our protein association projects.
Our team

M.D. Ph.D. Erik De Clercq
Erik De Clercq is a known professor, physician, scientist, virologist and drug developer for five decades. He has great interests in the field of microbiology, immunology, molecular biology and antiviral research, focusing on HIV, HBV, HCV, influenza, VZV, herpesvirus and merging viruses (e.g. Ebola, Dengue, Chikungunya). Since 1967, he has published more than 2700 research articles.
My curriculum vitae (CV)
My Publications
Current address: Rega Institute for Medical Research, Department of Microbiology and Immunology, KU Leuven - University of Leuven, Leuven, Belgium

Ph.D. Guangdi Li
Guangdi Li received his Ph.D. in Biomedical Sciences from Faculty of Medicine, KU Leuven, Belgium, 2014. His research interests focus on the genome-wide diversity, coevolution and interaction of HIV, HBV and HCV, as well as the development of antiviral drugs and vaccines. Since 2011, he has published more than 10 research articles.
My curriculum vitae (CV)
My Publications
Current address: Metabolic Syndrome Research Center, the Second Xiangya Hospital, Central South University, Changsha, Hunan, China
Email: liguangdi.research@gmail.com